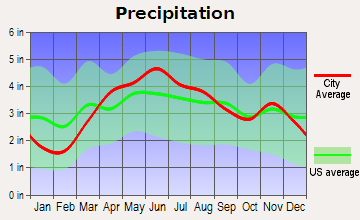
 Example of a line graph using data from Steger Annual Precipitation
In-Class:
Practiced using data tables to create line graphs and bar graphs.
Homework:
p. 183 Activity
"Create line graphs to display the data from Experiment 2 and Experiment 3 in the data table."
The data table is located at the top of p. 182
Students began assignment in class and should finish and review assignment at home.
Wednesday, October 25 - Early release 11:00am
Friday, October 27 - End of First Quarter